Is ‘Buy and Hold’ a Good Investment Strategy?
Inflation-adjusted stock prices might make you think twice.
Many legendary investors have stressed the importance of the Buy and Hold strategy. Studies have proven these investment legends correct by showing that investors typically hurt their profitability most when trying to time market oscillations. But the Buy and Hold strategy is not without its own risks.
To understand the potential pitfalls of the Buy and Hold strategy, we must visualize the data like few do.
How to Visualize Long-Term Stock Market Trends
Almost every investment website that provides stock charts will give you a visualization similar to this:

Well, it’s settled. Buy and Hold and you will be fine. The only trouble was in the early and mid 2000's.
Hold on. There are three major issues with this chart. First, the chart only goes back to 1950. Such a short timeline will never reveal important long-term price trends. Second, the y-axis is scaled linearly. We want a logarithmic scale so we can better visualize percent changes. We also want the chart to be in real prices (i.e. prices adjusted for inflation) instead of nominal prices.
Let’s step through how to make these changes to the basic chart above.
Step 1: Get More Data
Most investment websites (e.g. Yahoo Finance, Google Finance, StockCharts, etc.) don’t provide the longest available time frames. Fortunately, I was able to track down a dataset that goes all the way back to 1871. Let’s look at the chart with the extended timeline.

Step 2: Convert Y-Axis to Logarithmic Scale
The chart above makes it look like the stock market did nothing for over 100 years before it took flight in the 1980’s. To see the wild fluctuations (i.e. percent changes) before the 1980’s, we need a logarithmic-scaled y-axis. If you’re dealing with the standard investment sites, Excel or Matplotlib, you have the option to use a logarithmic scale. Always use the logarithmic scale when looking at stock prices over the long-term.

Step 3: Use Inflation-Adjusted (Real) Stock Prices
In the dataset I linked to above, the inflation-adjusted prices are conveniently located in the ‘Real Price’ column. Every data point in this column is priced in January 2000 dollars. Now, not only can we see the percent changes in detail, we can see how inflation has affected the price over time.

Uncovering the Stock Market’s Cycles
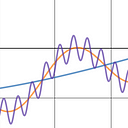
The natural world is filled with interesting cycles. The Earth’s orbit, the rise and fall of empires, and earthquakes are a few examples of things that behave cyclically. Seeing as how the stock market is a reflection of human nature, we‘d expect to find cycles there as well. And with our modified chart, we do.
With inflation-adjusted prices, we can see that the stock market has long uptrends and long downtrends.

Since 1871, there have been four major downtrends and four major uptrends. The most significant downtrend in terms of magnitude was the stock market crash that kicked off the Great Depression. It was a decline of over 80%. The longest downtrend was the 14-year downtrend from 1906 to 1920. The average duration of the downtrends was almost 10 years, and the average decline was about 68%.
Now let’s get to the good news. The uptrends far outweigh the downtrends. After all, the stock market is significantly above where it was in 1871. The largest uptrend — in terms of magnitude and duration — was the period between June 1932 and December 1968. This uptrend lasted 36.5 years and returned a colossal 755% price increase. The average duration of the uptrends was almost 23 years, and the average price increase was about 542%.
So, that settles it. Just buy stocks and hold onto stocks because the overall trend is in your favor. Actually, wait a minute.
‘Buy and Hold’ at the Wrong Time Could Be Disastrous
Everyone gets a finite amount of time to invest. If that time is for retirement investing, we get about 40 years. Furthermore, each one of us is seemingly born at random, so we are forced to invest during random 40-year time periods. I can’t go back in time and choose to Buy and Hold from 1932 to 1972. That would have been nice. I also can’t skip ahead to any ‘boom’ period in the future. I must play the cards I’m dealt.
So, what if you are dealt a really bad hand of cards? It has happened to investors before and it will happen again. If you happen to be a person unlucky enough to start your investment journey at a cyclical peak, it may take you years, if not decades, to break even. Below you can see how many years it took to break even for people who bought and held at a market peak.

From market peaks, the average time it took to break even (i.e. match the previous market high) was 22 years. On average, you make no money for over half your investment lifespan if you Buy and Hold at market peaks.
To think of these scenarios in more terrifying terms, imagine investing at the peak of 1906. You would have hit the breakeven point in 1928, one year before the Great Depression hit. After that selloff, it would have taken decades more to break even.
Imagine investing at the peak of 1929. You would have hit the breakeven point in 1958, almost 30 years later. Then, when you were about to retire around 1968–69, the market tanks again. Starting to invest at the wrong time can present one disaster after another.
But these worst-case scenarios don’t really discredit Buy and Hold because few are unlucky enough to start investing at peaks. What would happen if we randomized the investment starting points?
Randomized Investment Periods
Instead of looking at worst-case scenarios, let’s look at a bunch of random scenarios. I pulled 200 random dates out of the dataset and then discarded the later dates that couldn’t be used to calculate a 40-year return. I ended up with a sample size of 151.
I ran this experiment several times and got similar results each time. There was definitely a distinction between good times to start investing and bad times to start investing. Here are some of the results:
Top 20 Best Returns:

The top 20 returns are impressive. People who started their investment journey in the late 1970’s, early 1930’s, or early 1920’s enjoyed the best 40-year returns. People who started investing in the early 1980’s will most likely end up with great returns as well. But we don’t have the data yet to prove it. Since 1871, there were many great times to start investing.
Top 20 Worst Returns:
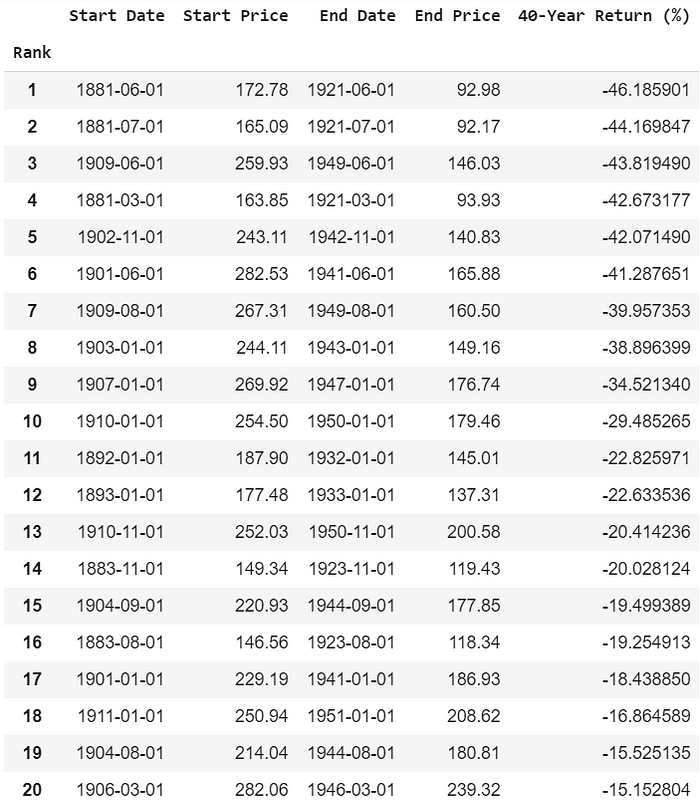
It would have been a miserable time to start investing during the late 1800’s or early 1900’s. If you ended up with a nice chunk of retirement money, it wasn’t because of stock market investing. Although the worst starting times for investing were clustered around these time periods, many other time periods yielded subpar returns as well.
Perhaps the most interesting part of this experiment was not the extremes but the average. The average 40-year return from this sample was 150.5%. That may sound great at first, but that’s only a 3.8% annual return. This just goes to show how bad inflation is for long-term profitability. There might be better ways to earn 3.8% per year than dealing with a volatile stock market.
So, what does this tell us about the Buy and Hold strategy?
Conclusion
Despite the dangers, I still believe Buy and Hold is a superior strategy than most. Certainly it is the best strategy for the average investor. Investing during periods of very low inflation coupled with stock market manias can be catastrophic for long-term profitability. But investing during high-inflation stock market panics can lead to remarkable profits in the long-term.
It’s important to keep in mind that the analysis above is simplified. Most people wouldn’t Buy and Hold at one time period and never add or subtract to that position later on. If one were to keep making payments into their portfolio during a downtrend, for example, they would break even much sooner on the way up. We must also consider taxes and fees that will eat away at profits, and proper diversification and reinvestment of dividends that will add to profits.
Investing is complicated, and the market can be very unforgiving. I hope this post will make you more aware of potential risks.
To send you off with a bit of encouragement, I’ll leave you with a quote from the Oracle of Omaha:
“And if they insist on trying to time their participation in equities, they should try to be fearful when others are greedy and greedy only when others are fearful” — Warren Buffett
Note: This post is not investment advice. Before you make changes to your investment portfolio, you should do your own research and/or talk with a financial advisor.